Project Scope
- 1 Project Manager
- 1 Designer (me)
- A team of developers
Enter the password to view this case study.
Incorrect password. Please try again.
← Back to selected work
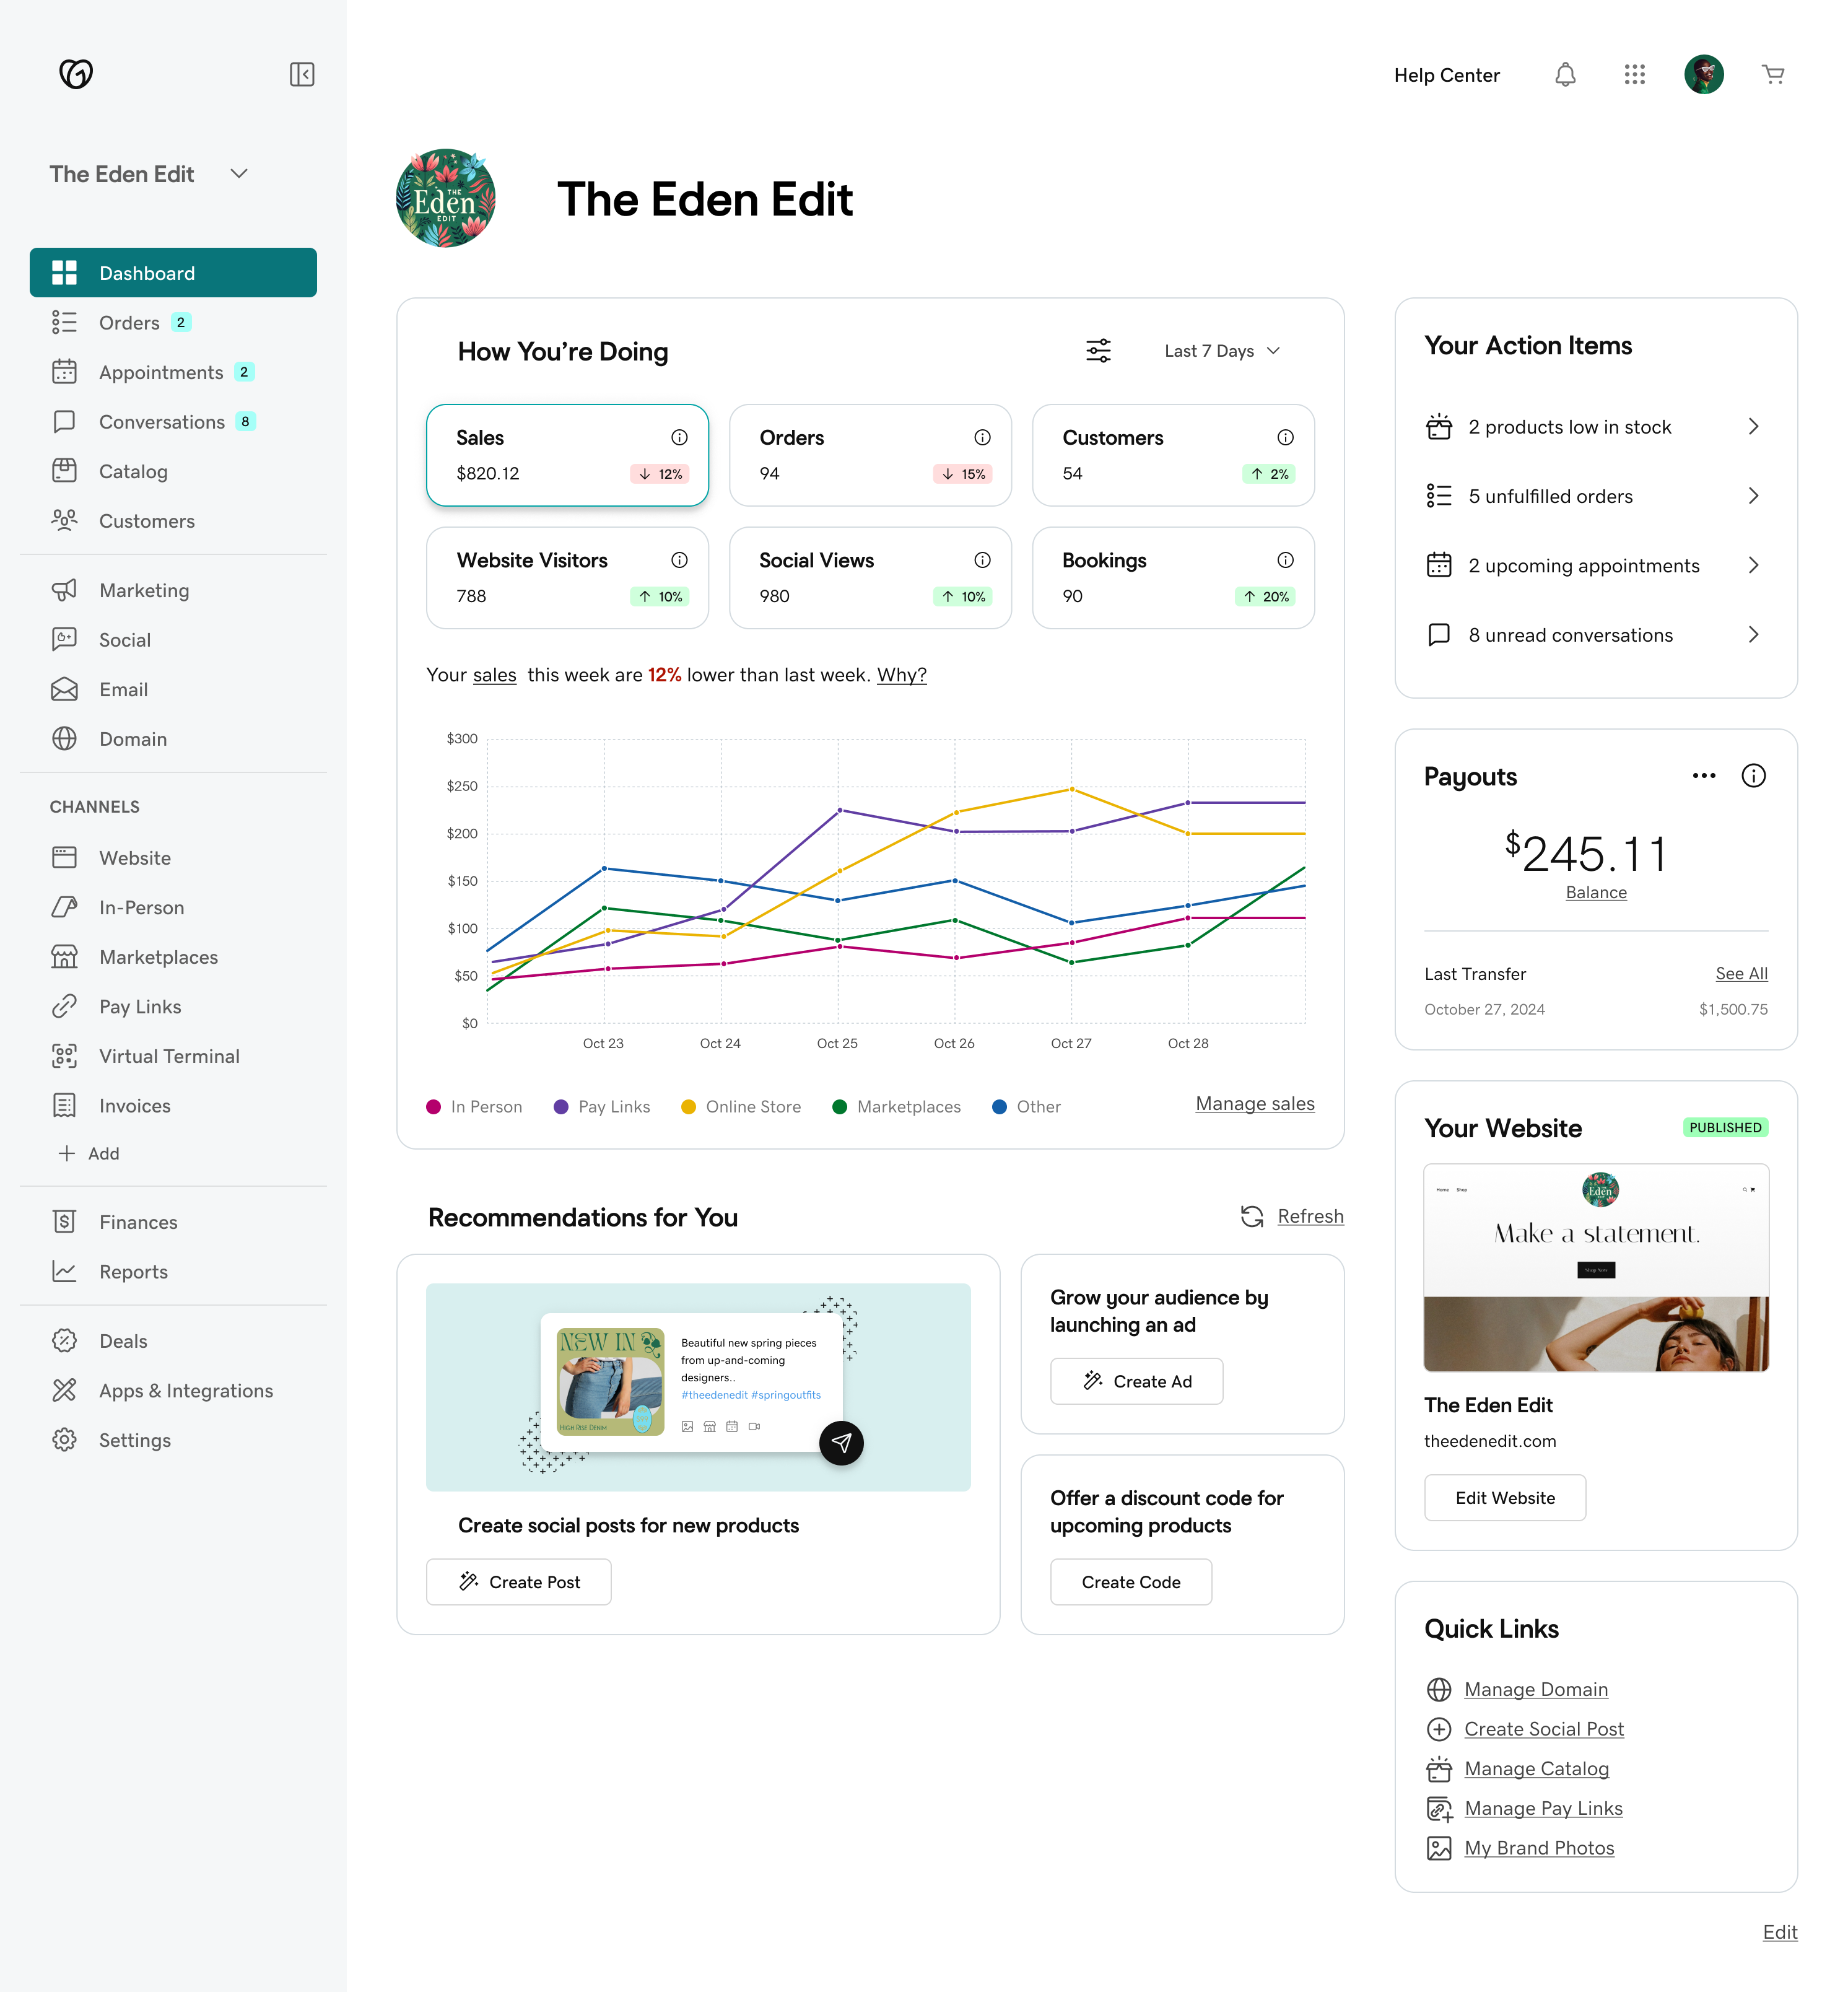
Overview: This is a unified platform that enables merchants to understand data across e-commerce and in-person channels.
Commerce and Venture home served different purposes but were experienced by the same sellers — making daily operations unnecessarily hard.
Sellers struggled because two dashboards co-existed with no unified logic for data, navigation, or permissions — making daily operations unnecessarily hard.
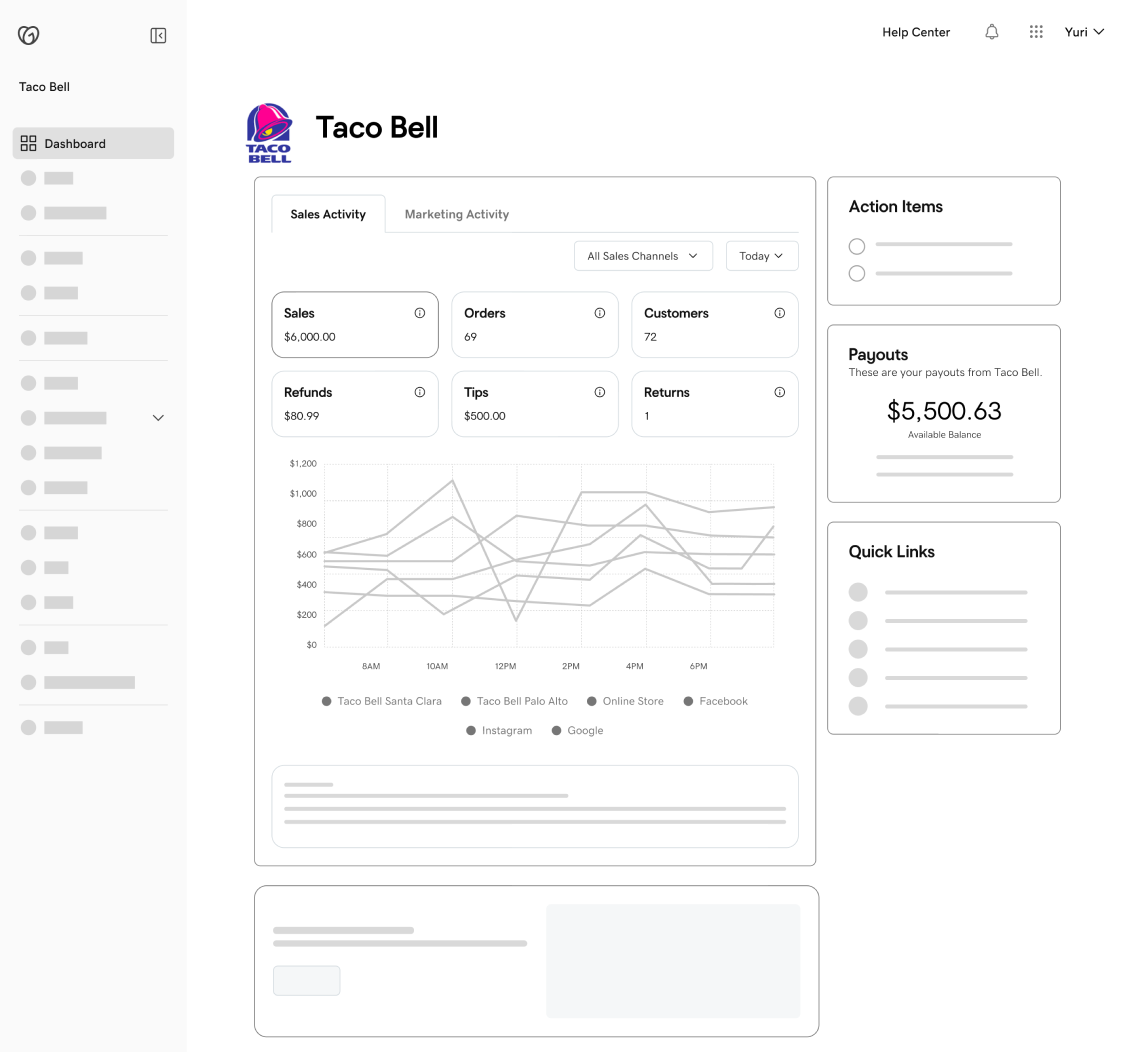
Dashboard with varying levels of access, navigation elements & filters, data representation for omni-channel scenarios:
Based on the core issues, we aligned on two concrete goals that would define success for this project.
Define clear access tiers for different seller roles — from LLC-level owners managing multiple brands, to store managers scoped to a single location — and reflect these in the UI.
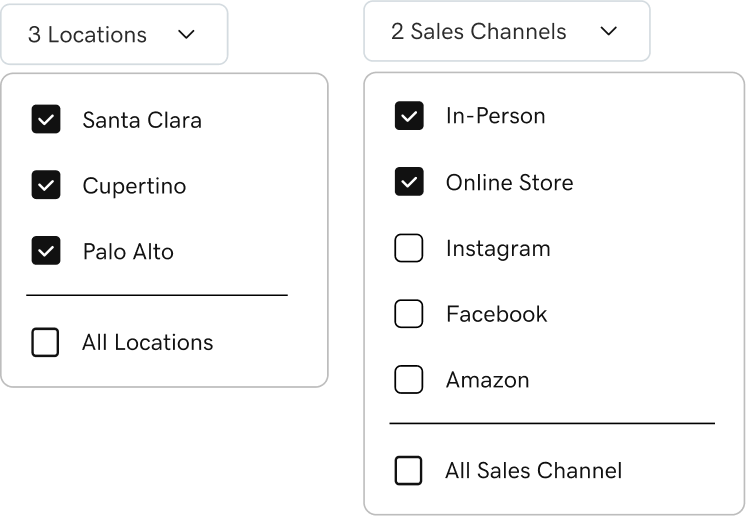
Replace the existing single-select filter with a model that supports multi-location and multi-channel comparison — and can accommodate future omni-channel scenarios like BOPIS, BORIS, and ROPIS.
Four key roles in the Yum Brands LLC hierarchy — from LLC owner to individual store manager — each with distinct access needs.

Owns Yum Brands LLC for Taco Bell, KFC

Managing Partner for Taco Bell — not Yum Brands LLC

Managing Partner for Pizza Hut — not Yum Brands LLC

Store Manager at Pizza Hut @ Santa Clara
| Role | Allowed ✅ | Not Allowed ❌ |
|---|---|---|
| Brands Overall Ownere.g. Yuri | Access all brand data · View aggregated reports · Manage all products & billing | Full access (no restrictions) |
| Sub Brand Ownere.g. Tobias, Katrina | Access specific brand data · View brand-wide reports · Manage brand products & billing | Cannot access other brands |
| Store Managere.g. Silas | Access assigned store data · View store metrics · Manage daily store ops | No other stores' data · No billing/products · No brand/LLC settings |
Example

From permission model to screen
The model told us
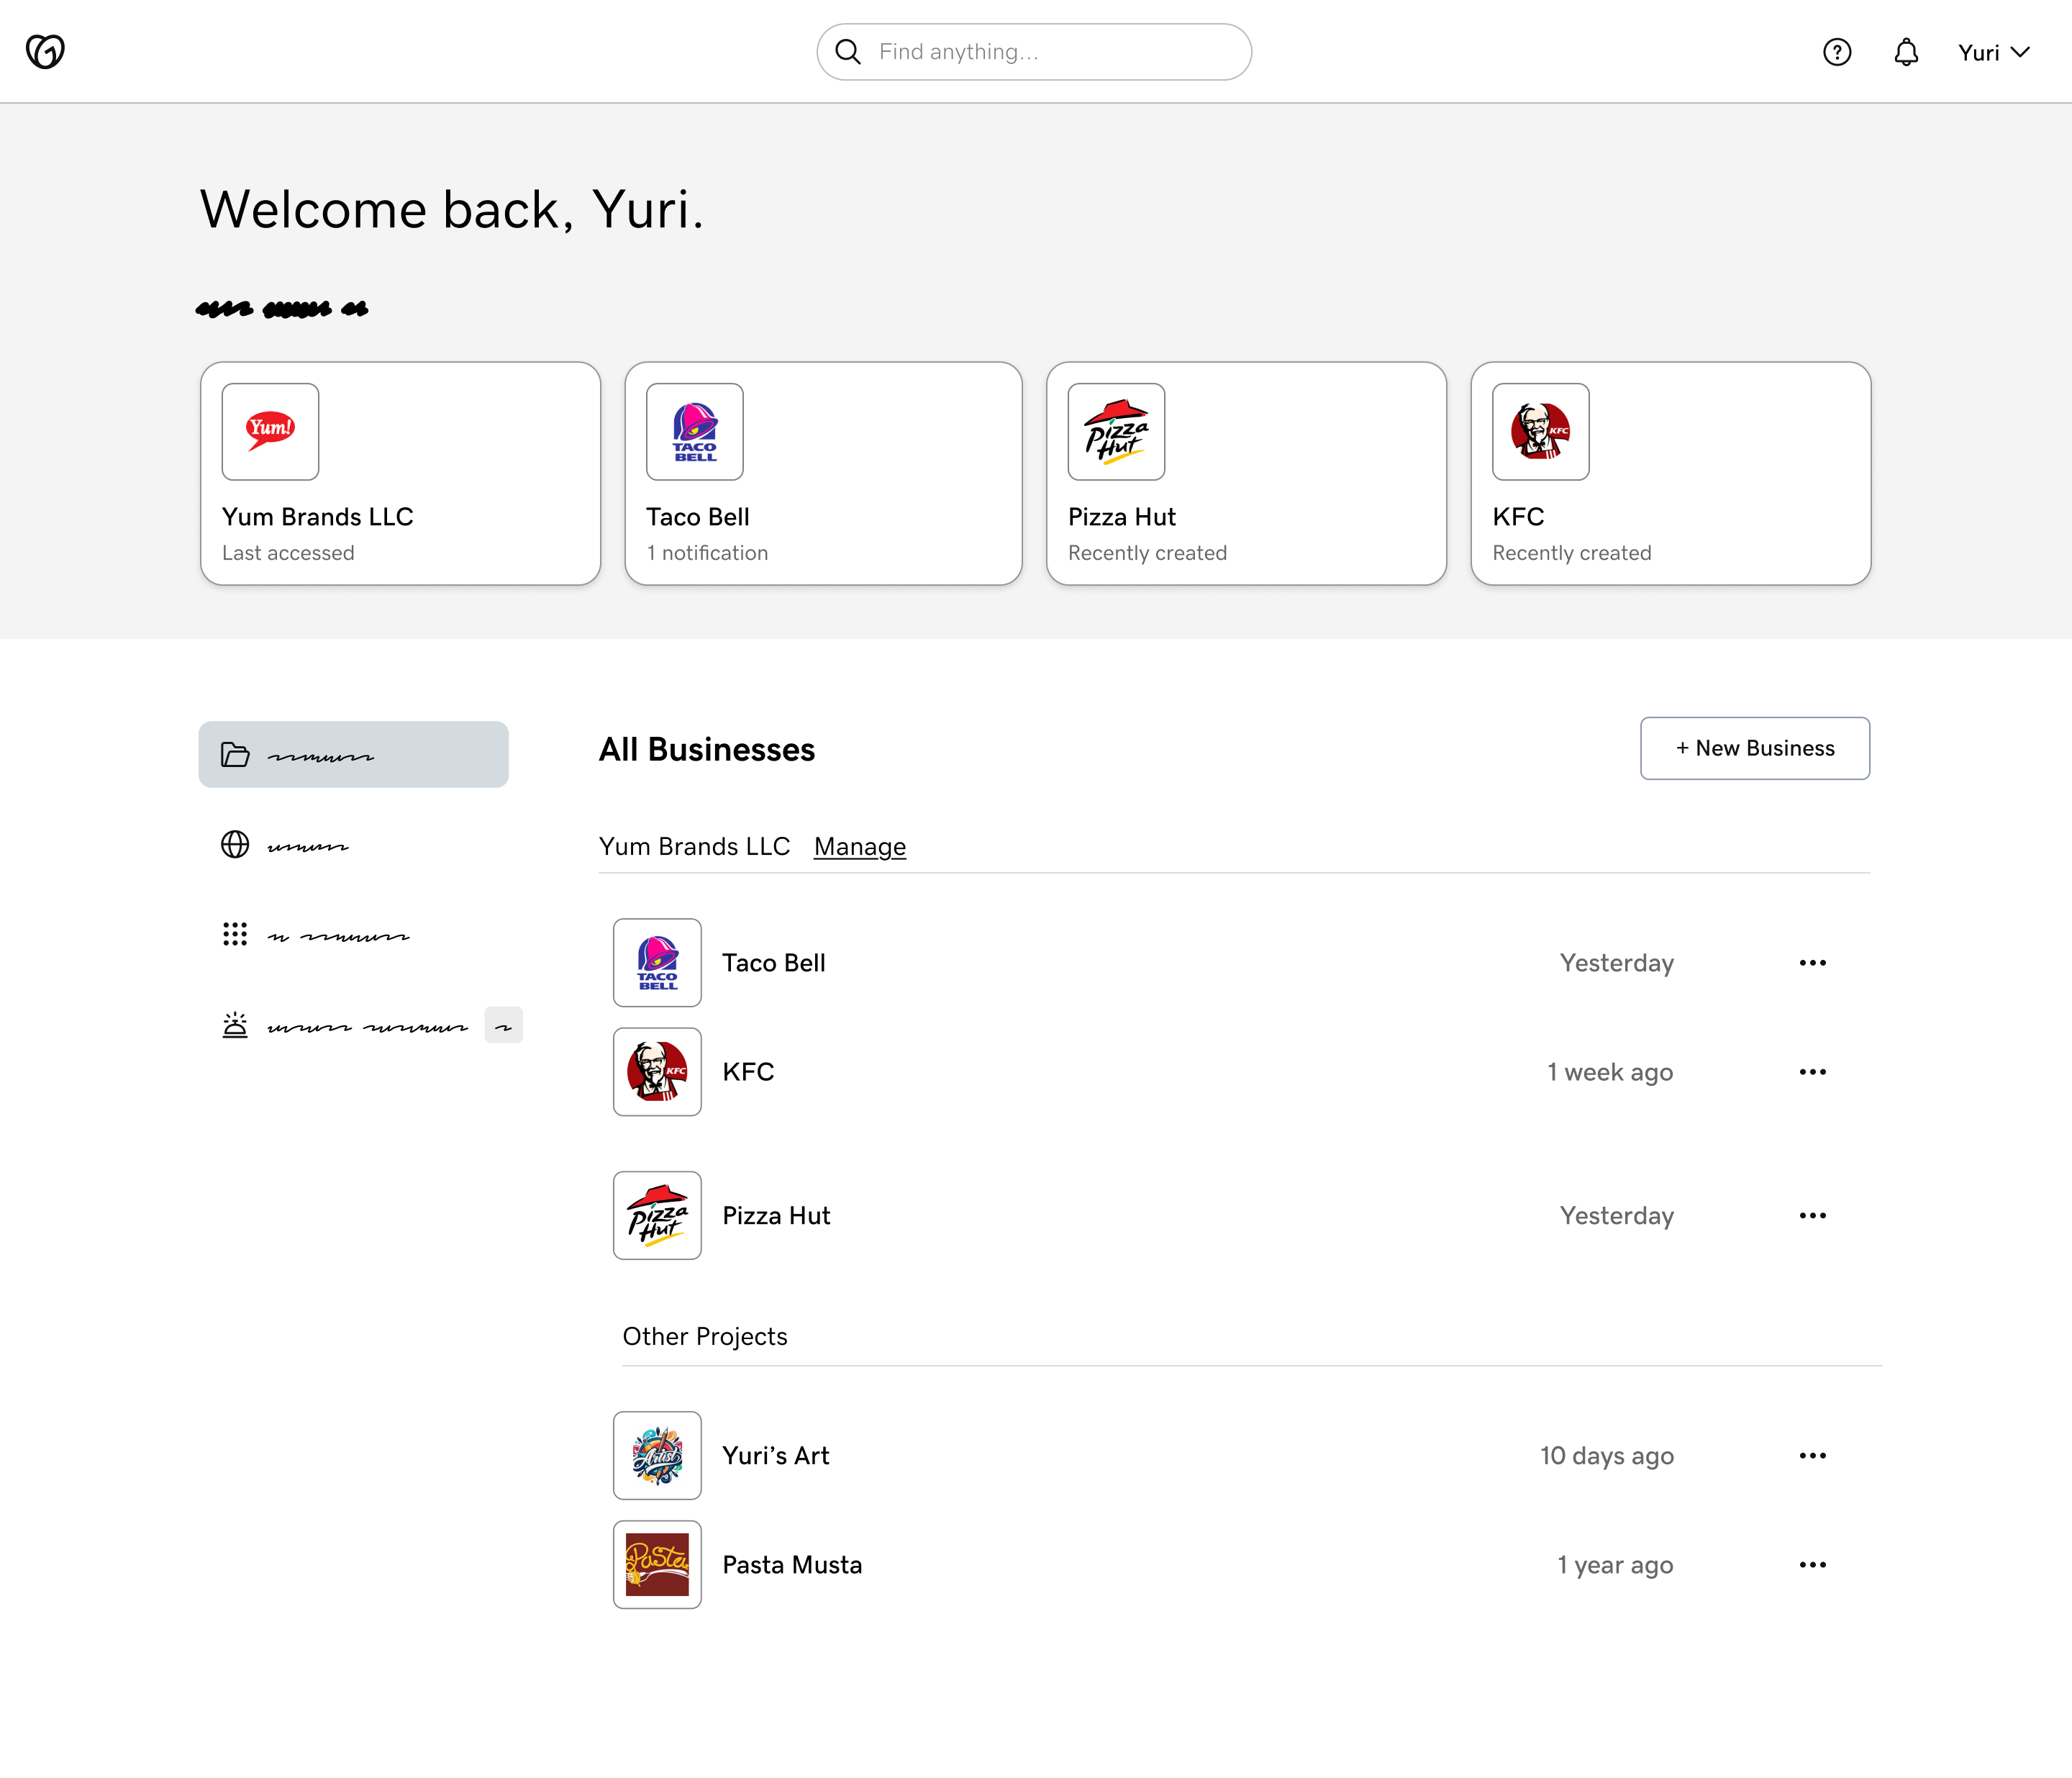
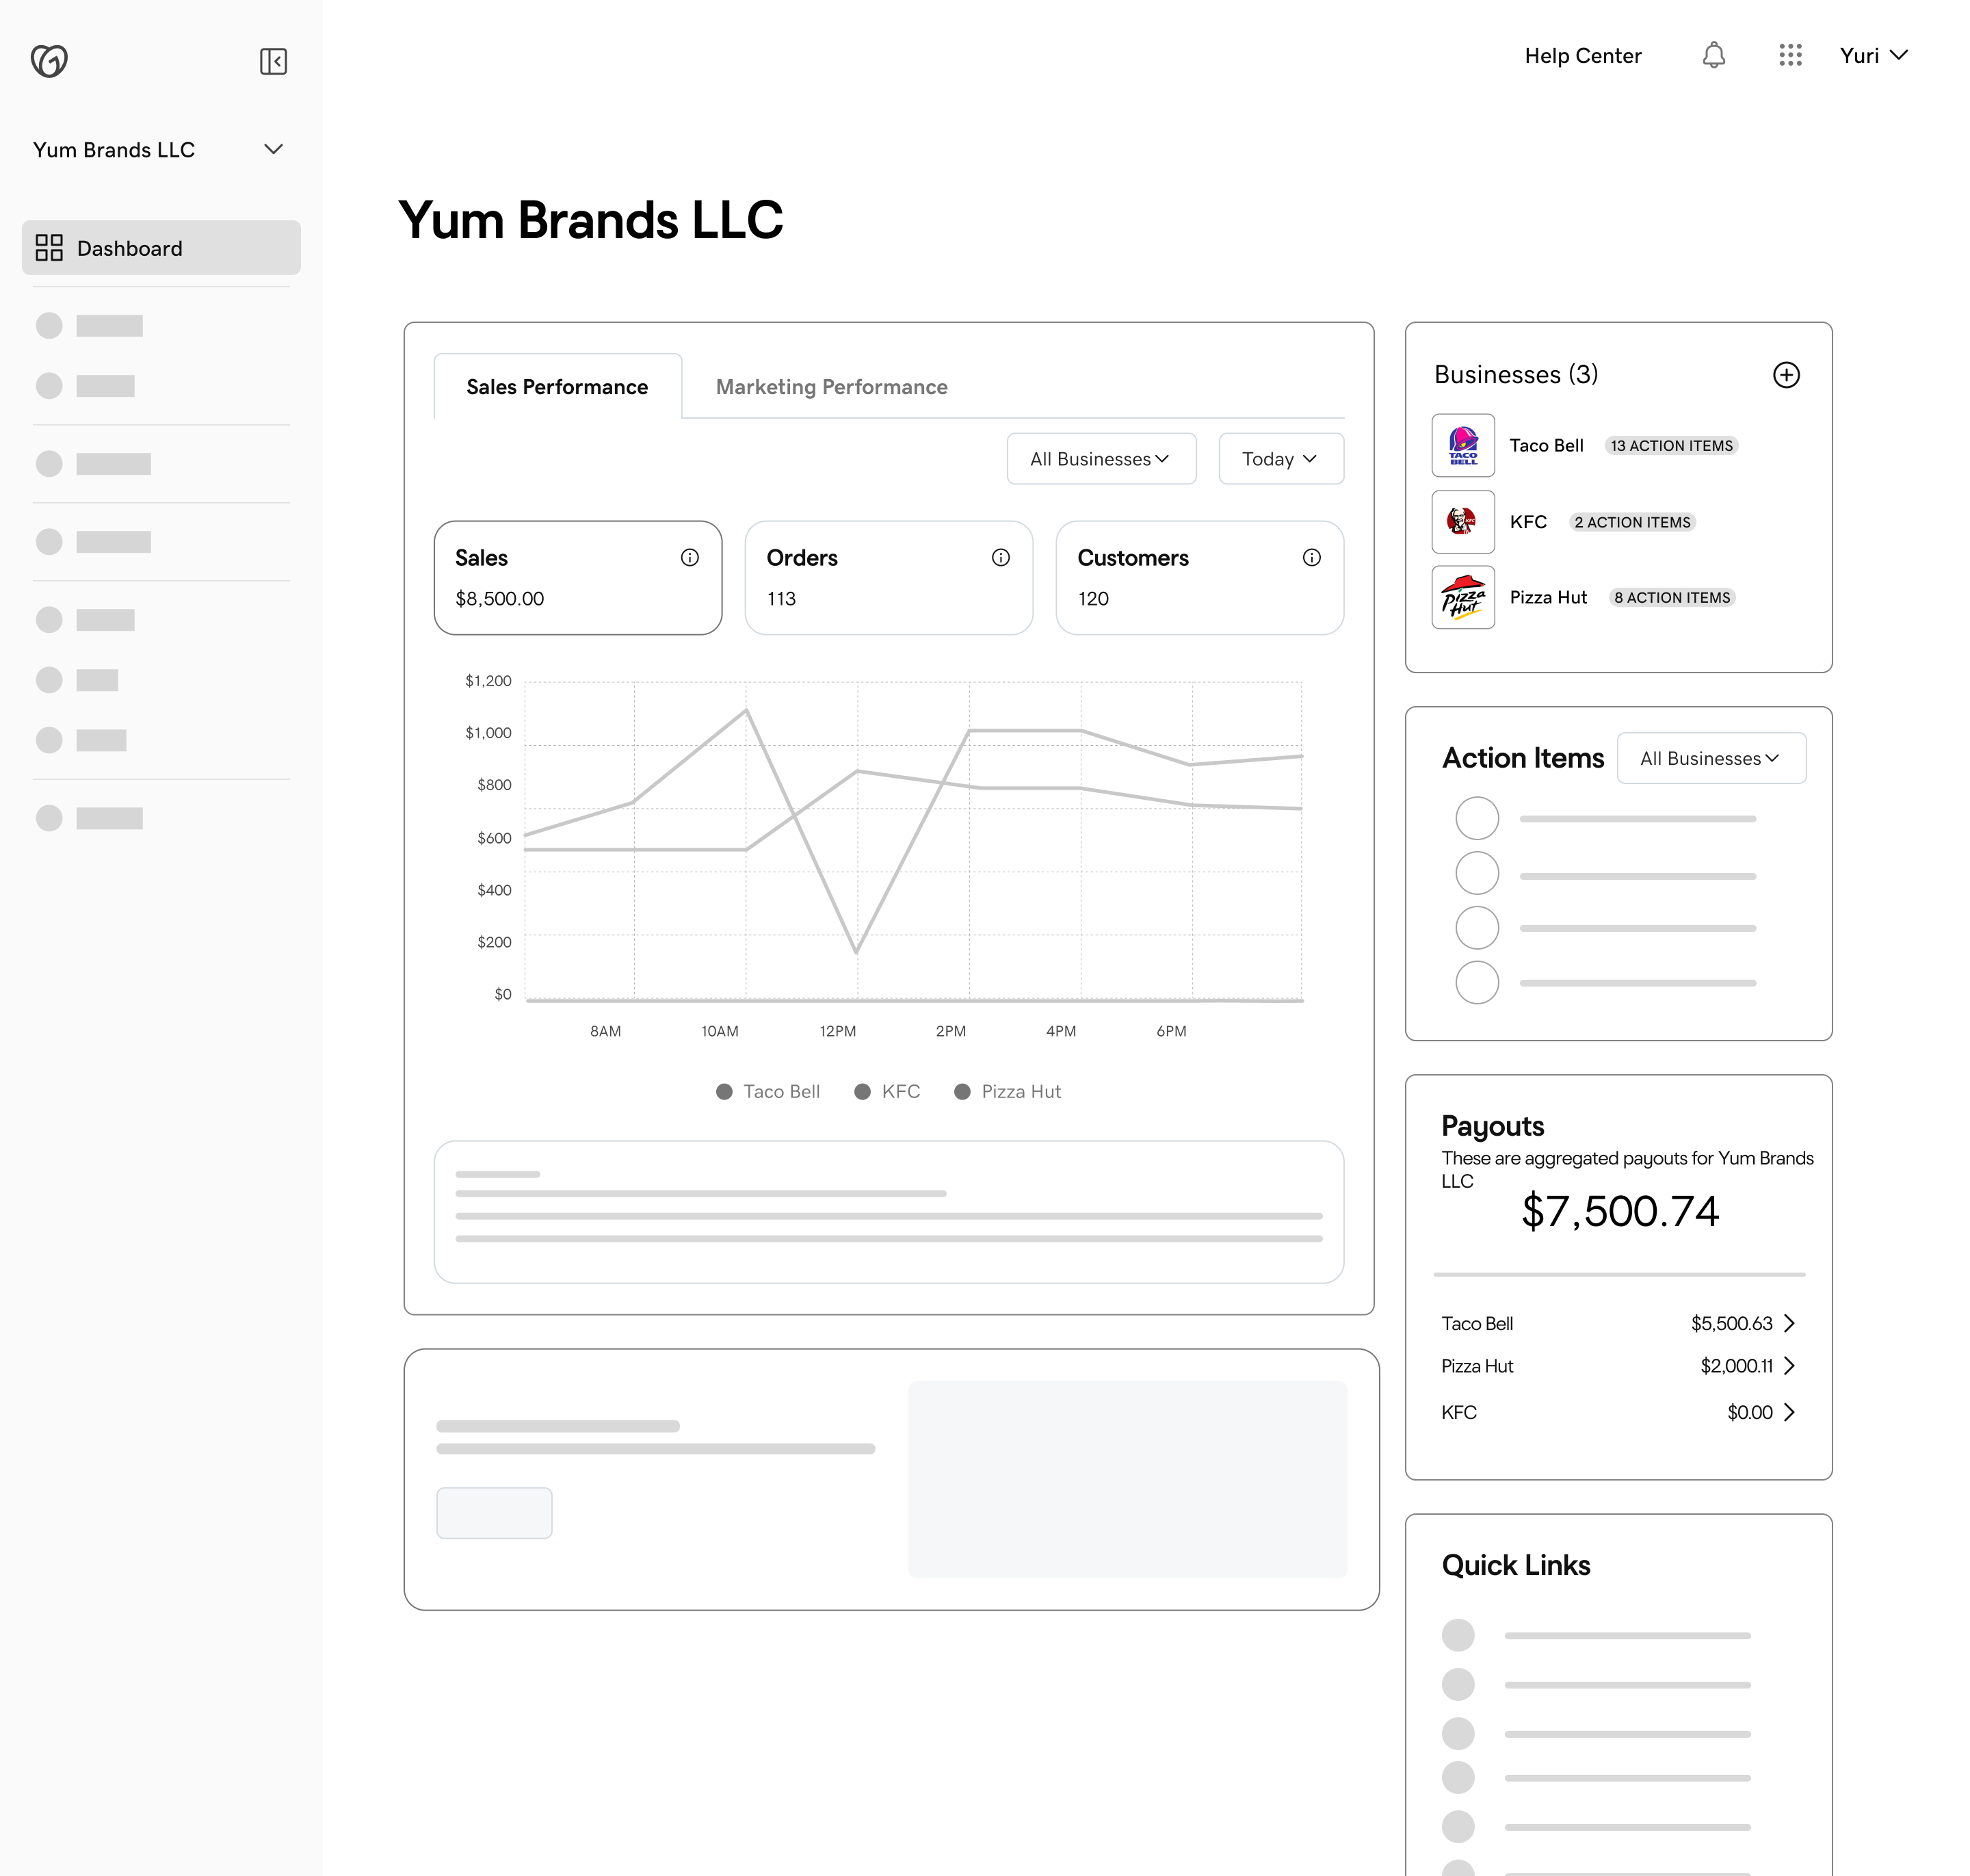
Yuri needs a cross-brand home — aggregated metrics across Taco Bell, KFC, Pizza Hut in one view, with the ability to drill into any brand.
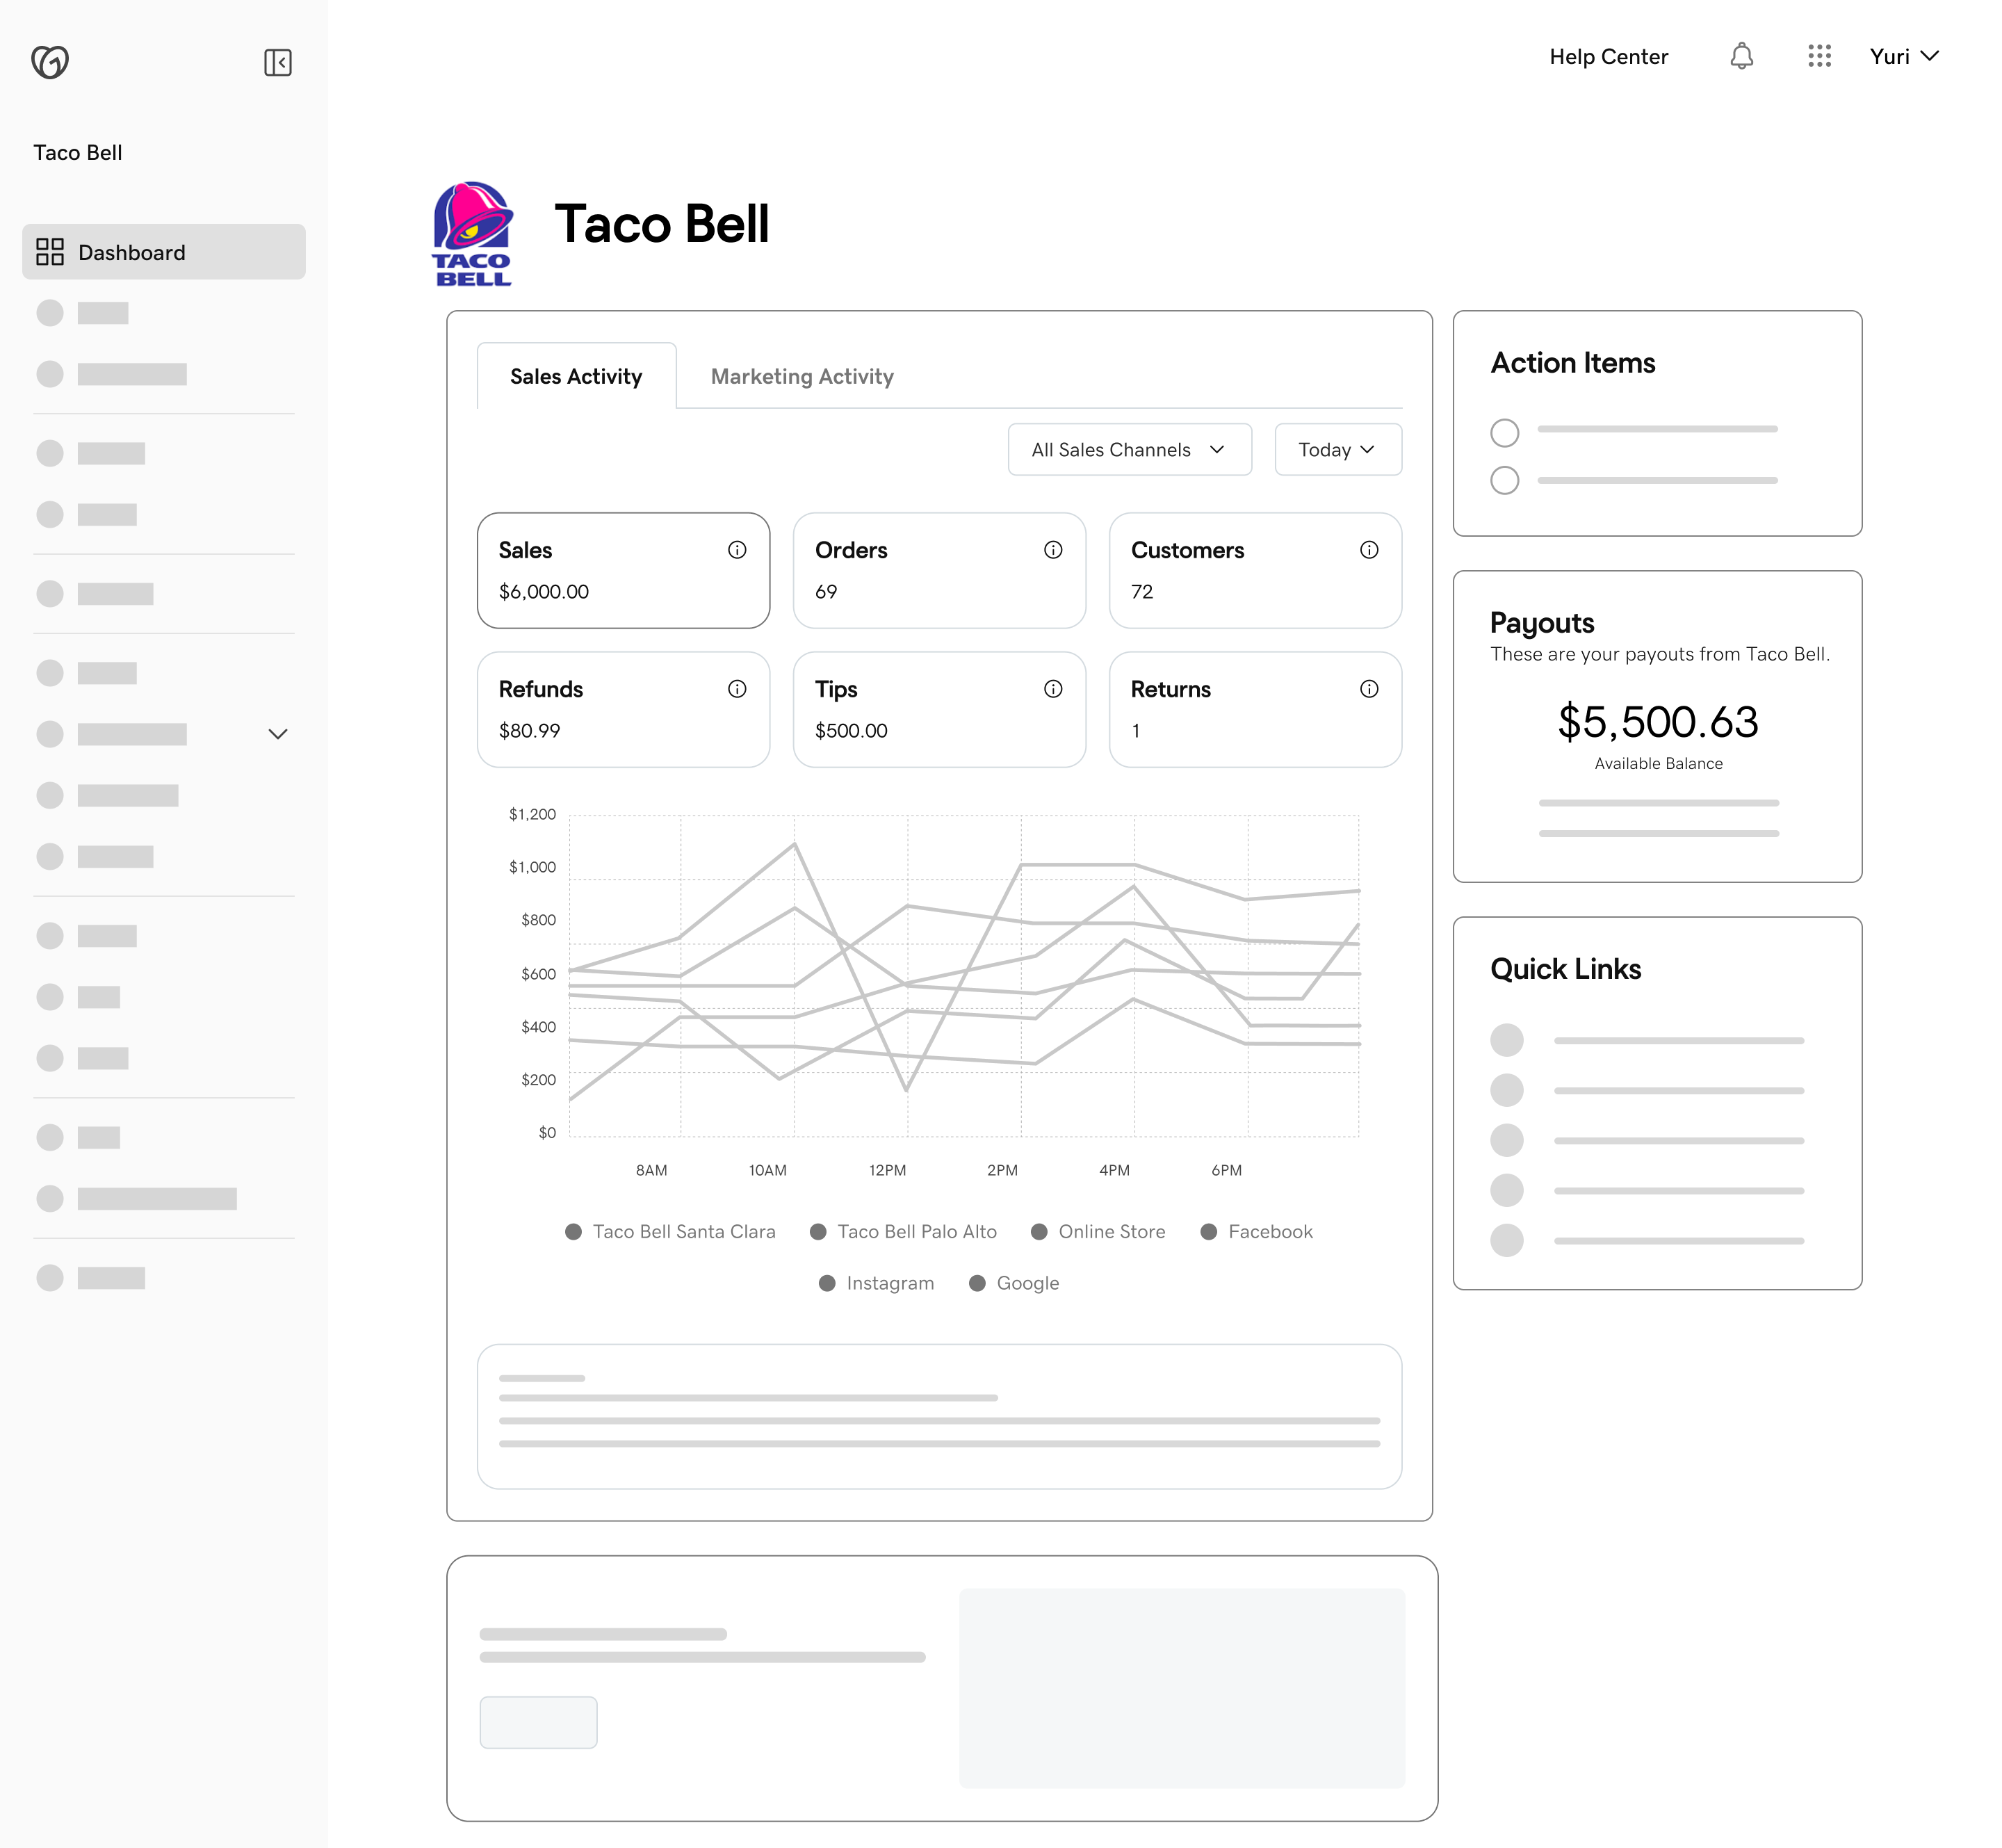
Tobias and Katrina land directly in their brand's dashboard — no cross-brand data, no access to billing or LLC-level settings.
Silas only sees data for his assigned store. No other stores, no brand-level settings, no billing.
So we designed
Brand switcher + aggregated dashboard with cross-brand metrics. Yuri can navigate between Taco Bell, KFC and Pizza Hut without leaving the home.
Tobias lands on Taco Bell's dashboard only. The navigation and data surface is identical in structure — but scoped strictly to their brand.
All roles share the same navigation structure and component library — permissions control the data, not the layout.
Each role gets a scoped view of the same underlying dashboard — the permission model directly determines what's visible and accessible.
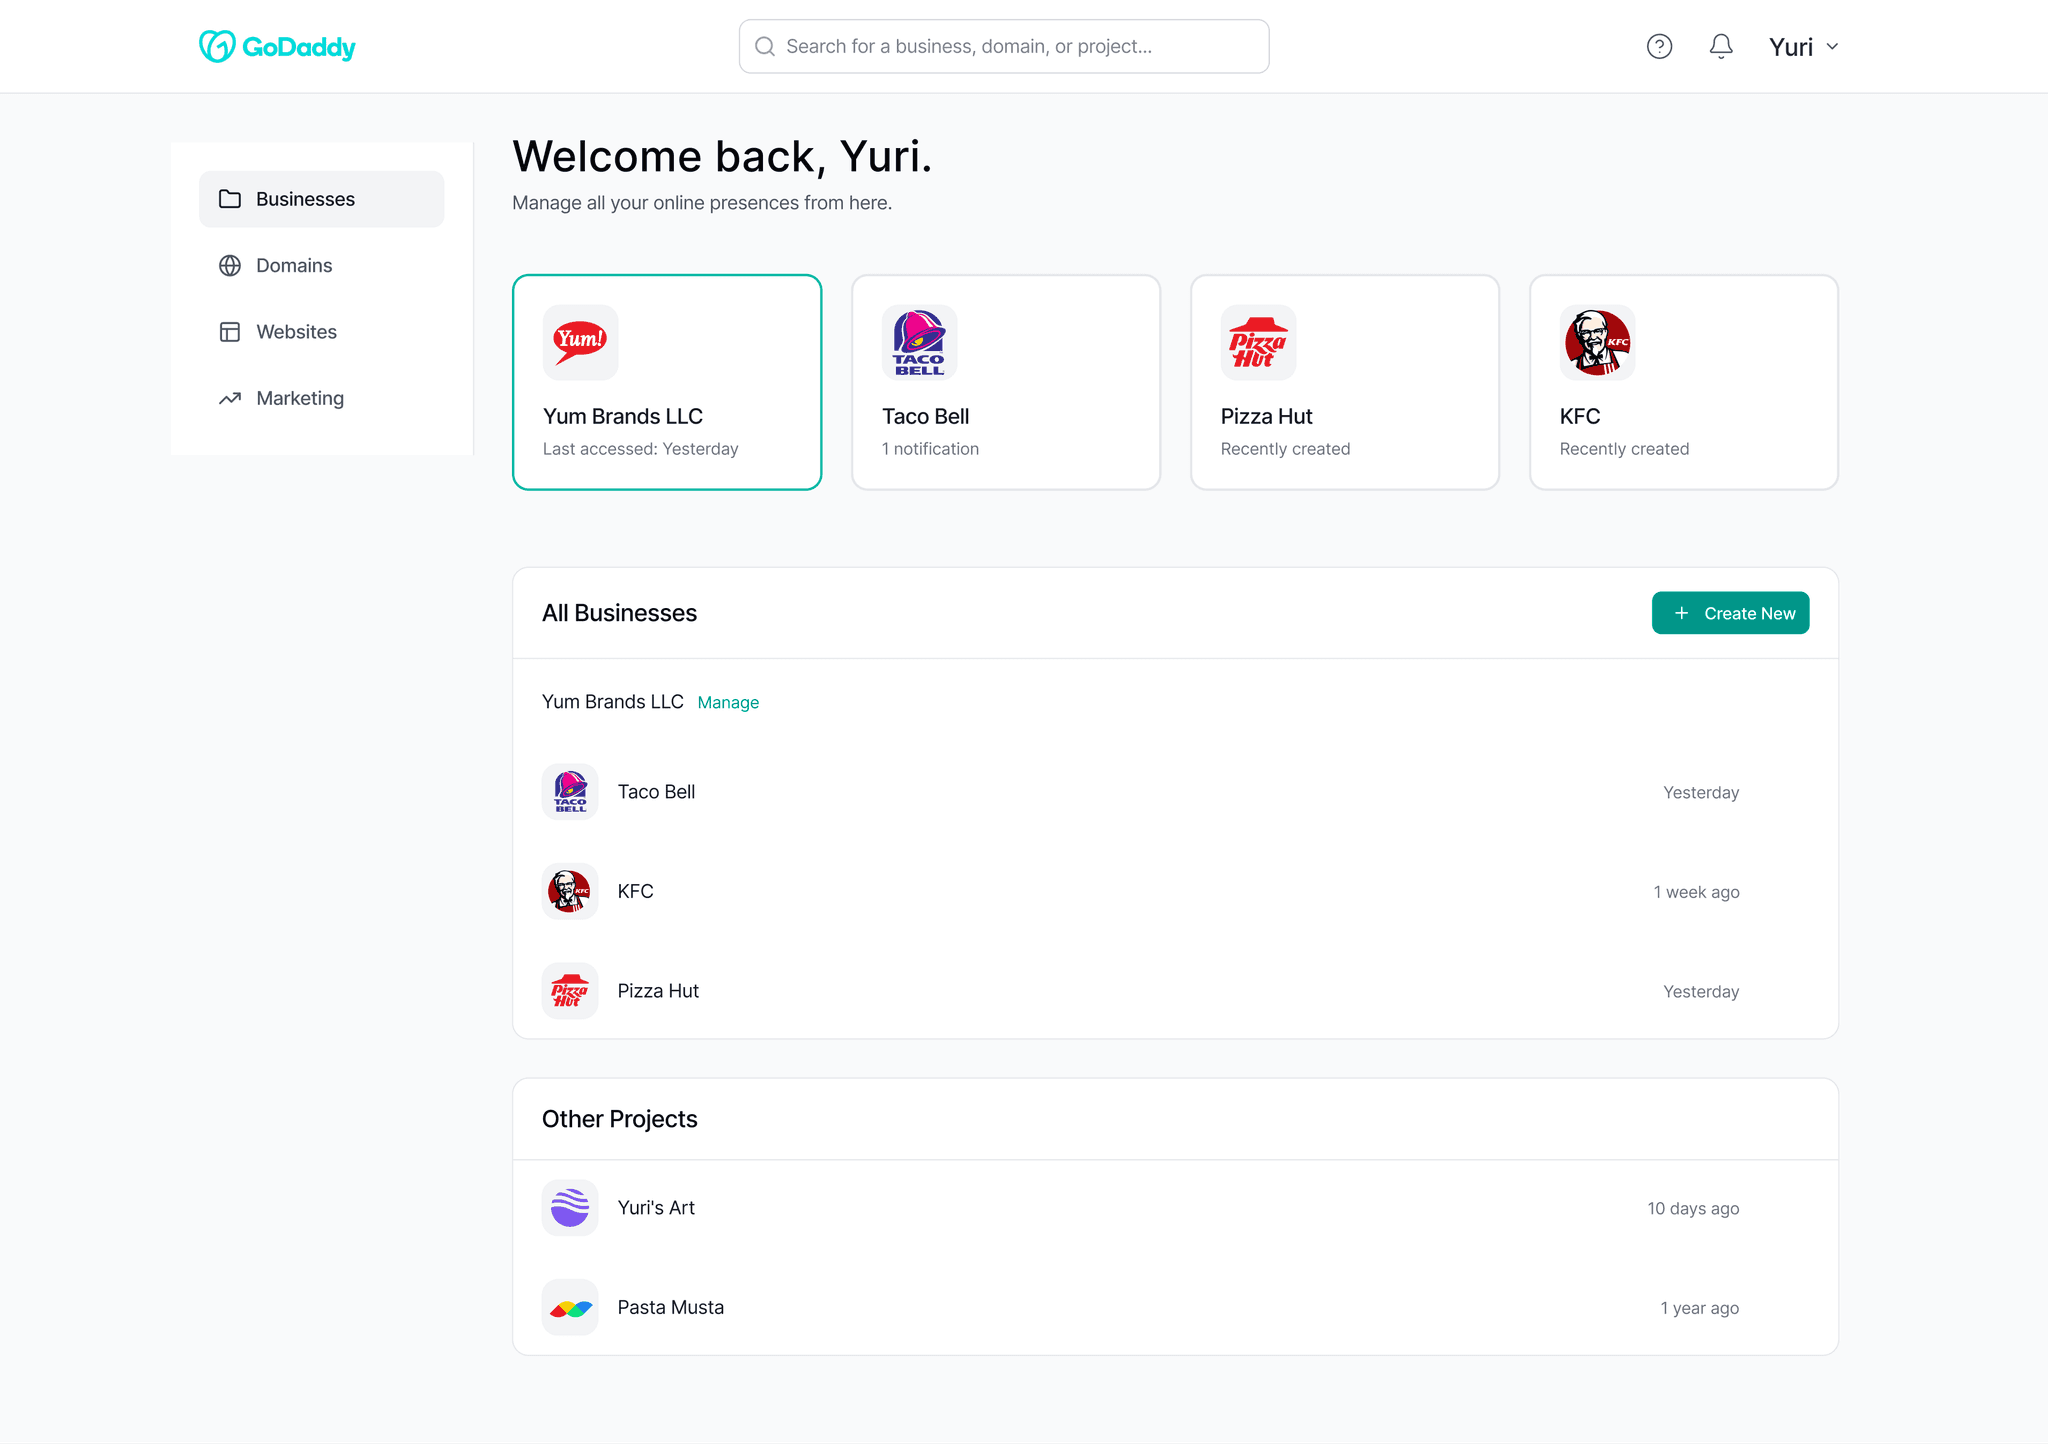
Owner — Yuri
Owns Yum Brands LLC for Taco Bell, KFC
Welcome back, Yuri.
All Businesses
Yum Brands LLC
Owner view: Multi-business switcher at top + aggregated cross-brand dashboard. Payouts and Action Items visible across all brands.
Manager — Tobias, Katrina, Silas
Brand or store-scoped access only
Taco Bell
Taco Bell
Manager view: Same dashboard structure as Owner — but scoped strictly to their brand. No cross-brand navigation, no LLC-level settings.

Owns Yum Brands LLC for Taco Bell, KFC

Managing Partner for Taco Bell -- not Yum Brands LLC.

Managing Partner for Pizza Hut -- not Yum Brands LLC.

Store Manager at Pizza Hut @ Santa Clara.
The next design challenge
Once we established who sees what, a deeper question surfaced: within their permitted scope, how do sellers filter and compare data across locations and channels to make meaningful business decisions?
Compare performance across locations to quickly identify underperformance and opportunities.

Sales span multiple channels—understanding which drive revenue helps prioritize where to focus next.
Analyzing data across locations and channels requires more than simple filters—thoughtful filtering is key.
Why it matters
The filter directly affects how sellers read their charts and, in turn, the quality of the business decisions they make. A poor filter = misleading data = wrong decisions.
What we needed to answer
How should sellers select, combine, and compare across locations and channels — without cognitive overload? We ran targeted research and tested three filter proposals to find out.
Research & filter exploration below
Two concept tests with 10 SMB participants to validate dashboard comprehension and understand how sellers mentally model “sales” and “sales channels”.
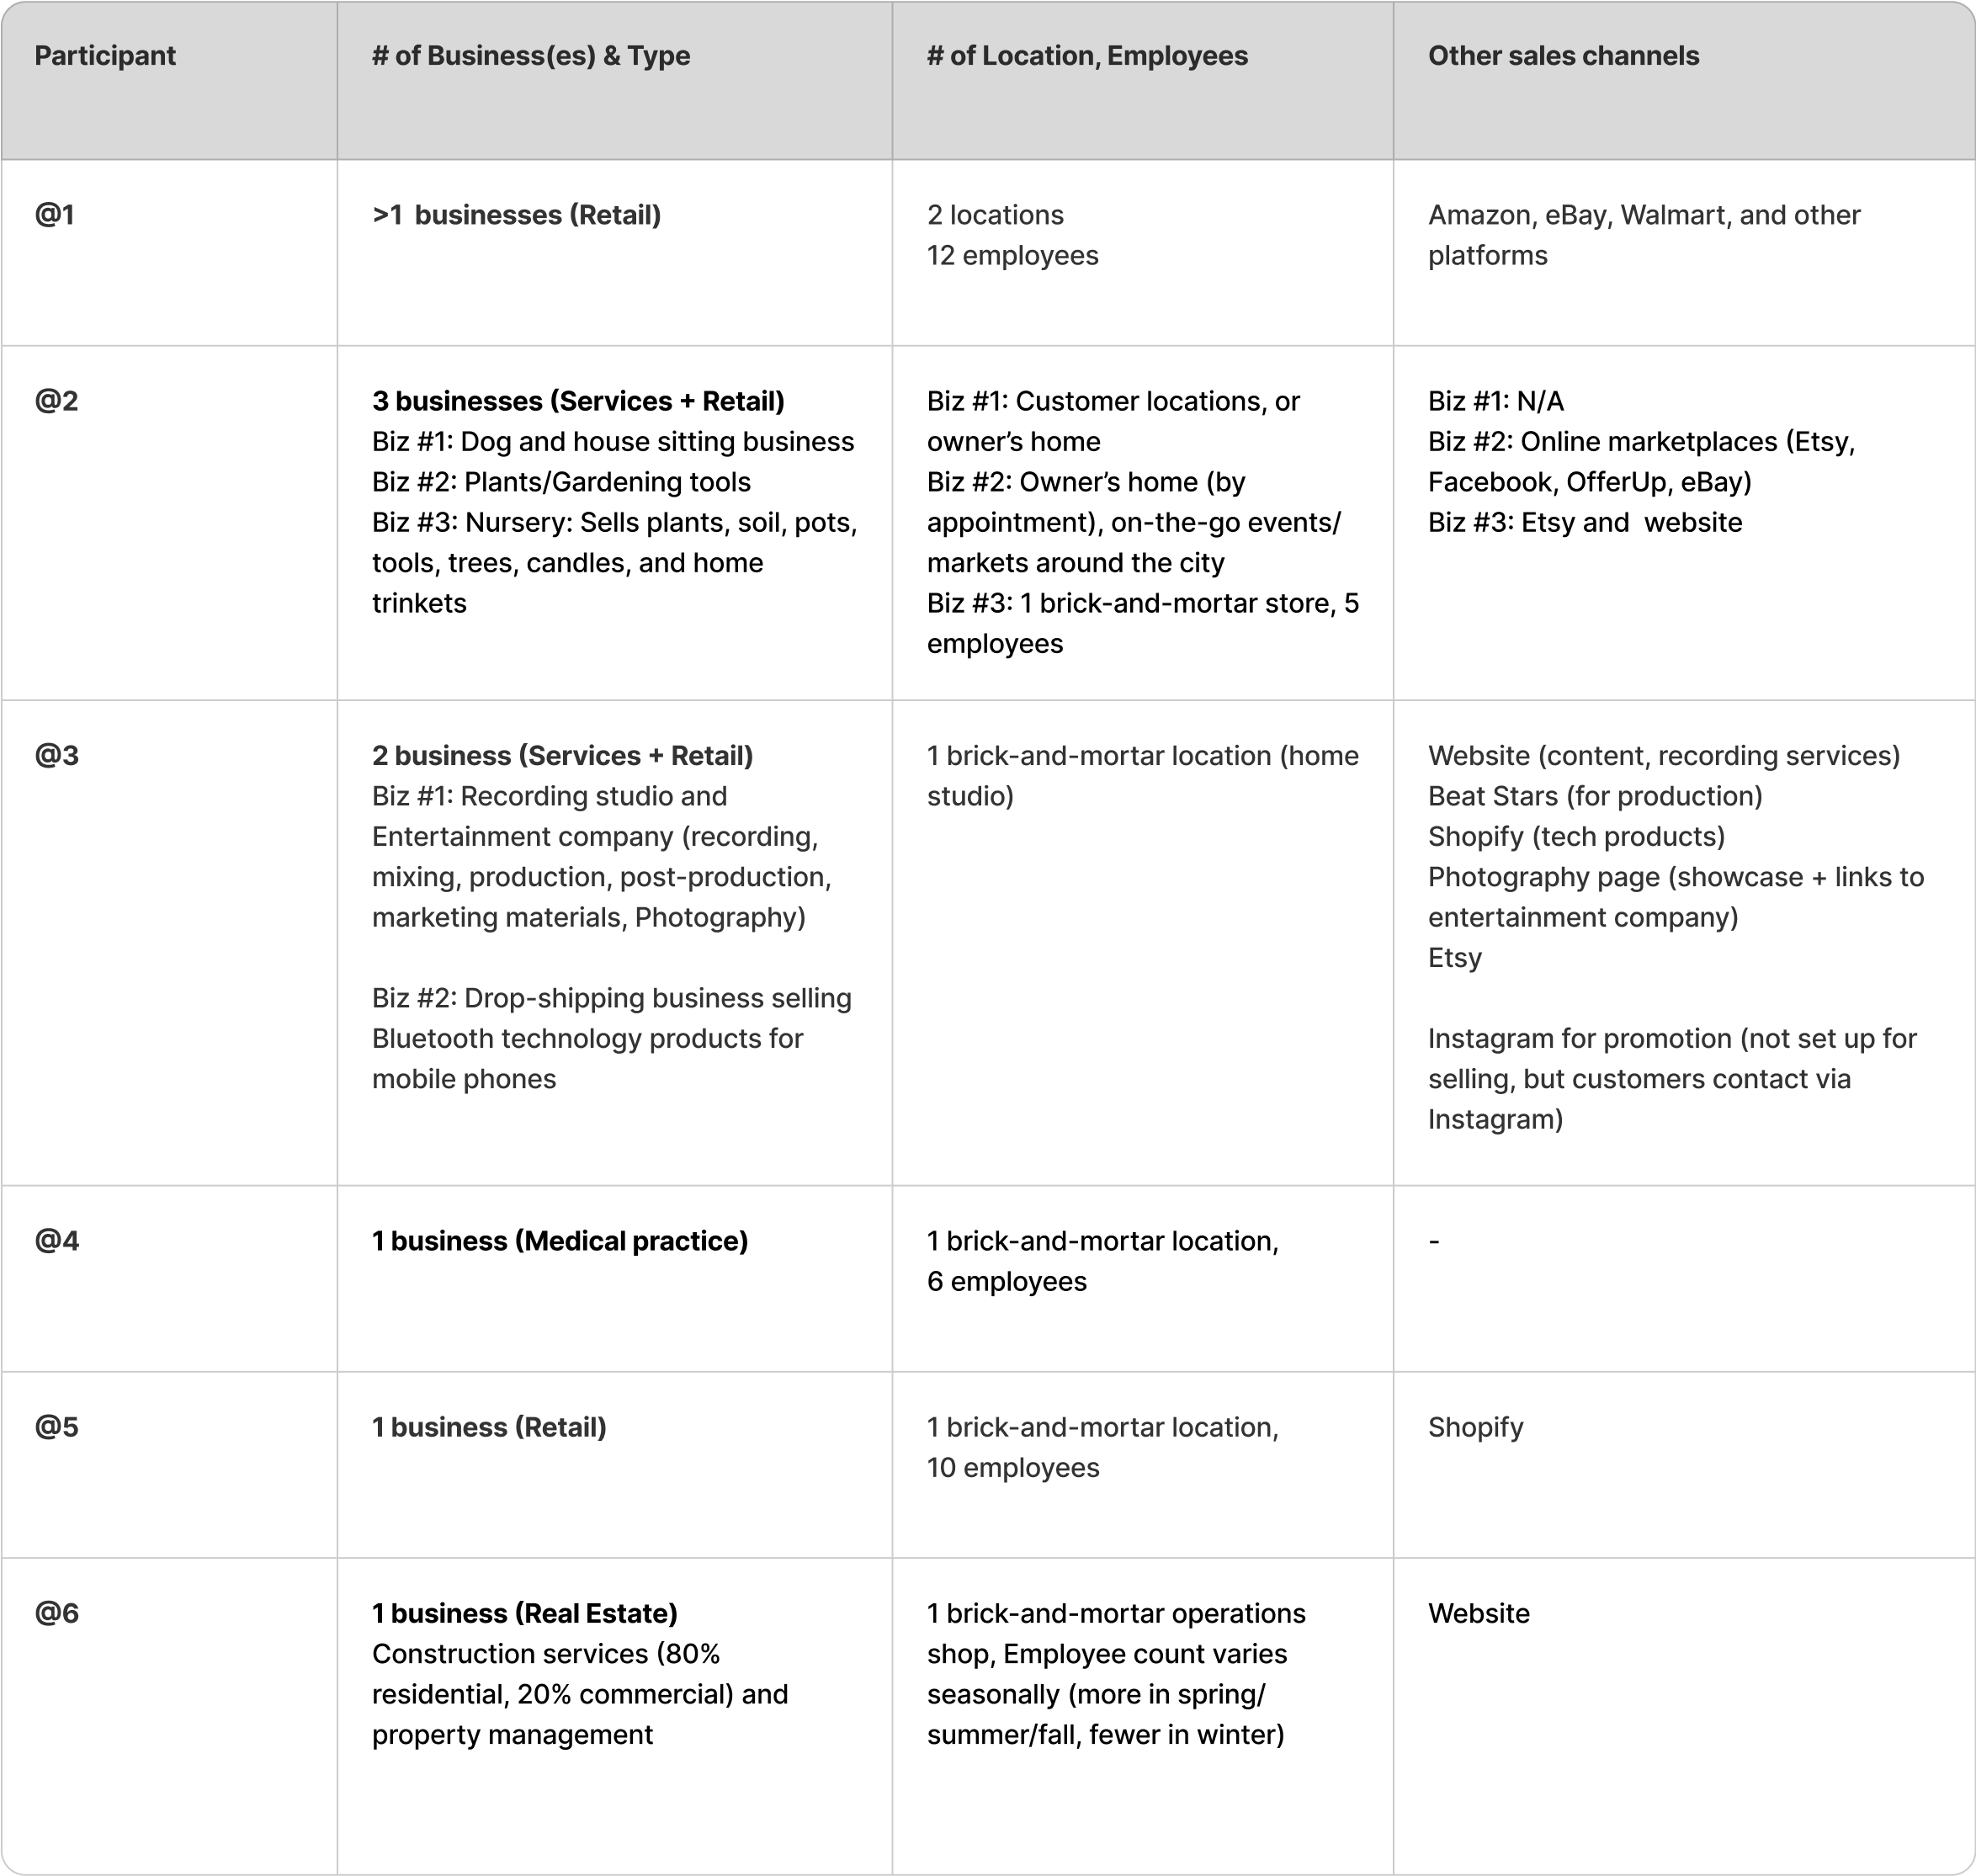
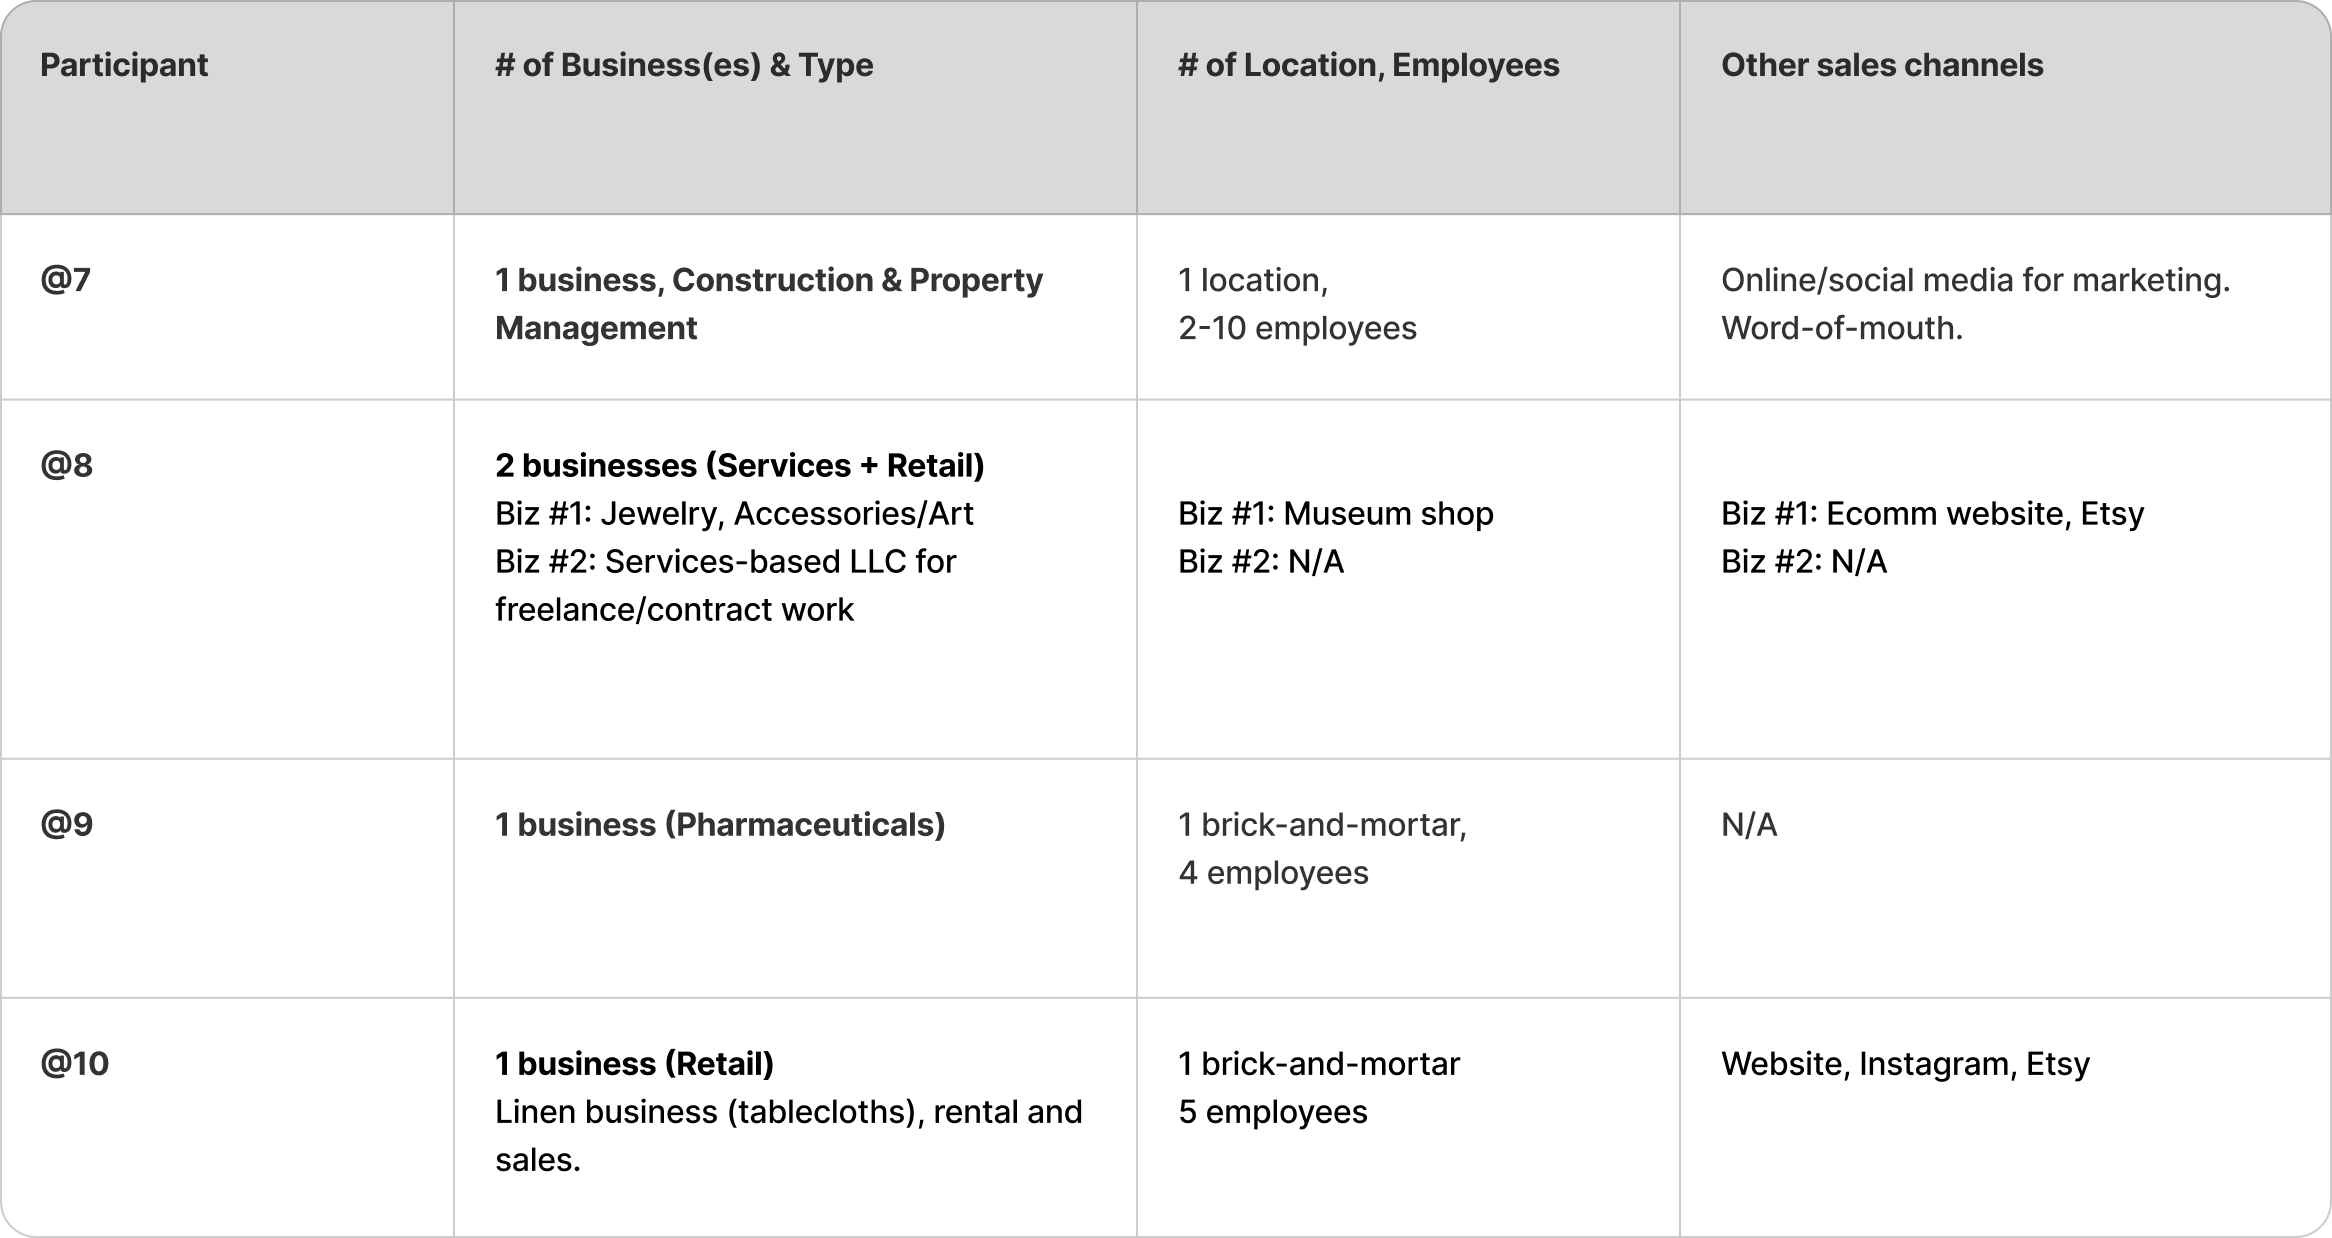
Method & Participants
Test 1: Multi-location/multi-channel business-level dashboard with metrics, data viz. and filtering.
Test 2: Multi-business dashboard with cross-brand metrics and data viz.
Key Insights
Two core research questions shaped the tests: how do users define “sales” and “sales channels”, and how do they comprehend the dashboard?
Majority equate sale = payment. 7/10 said $25 should be reported as a sale as soon as the customer pays online.
“Sales channel” is confusing. Most users defaulted to “both in-person and online” rather than identifying a single channel origin.
Unpaid order ≠ sale. All 10 participants agreed an order placed without payment is not a sale — order source ≠ sales channel.
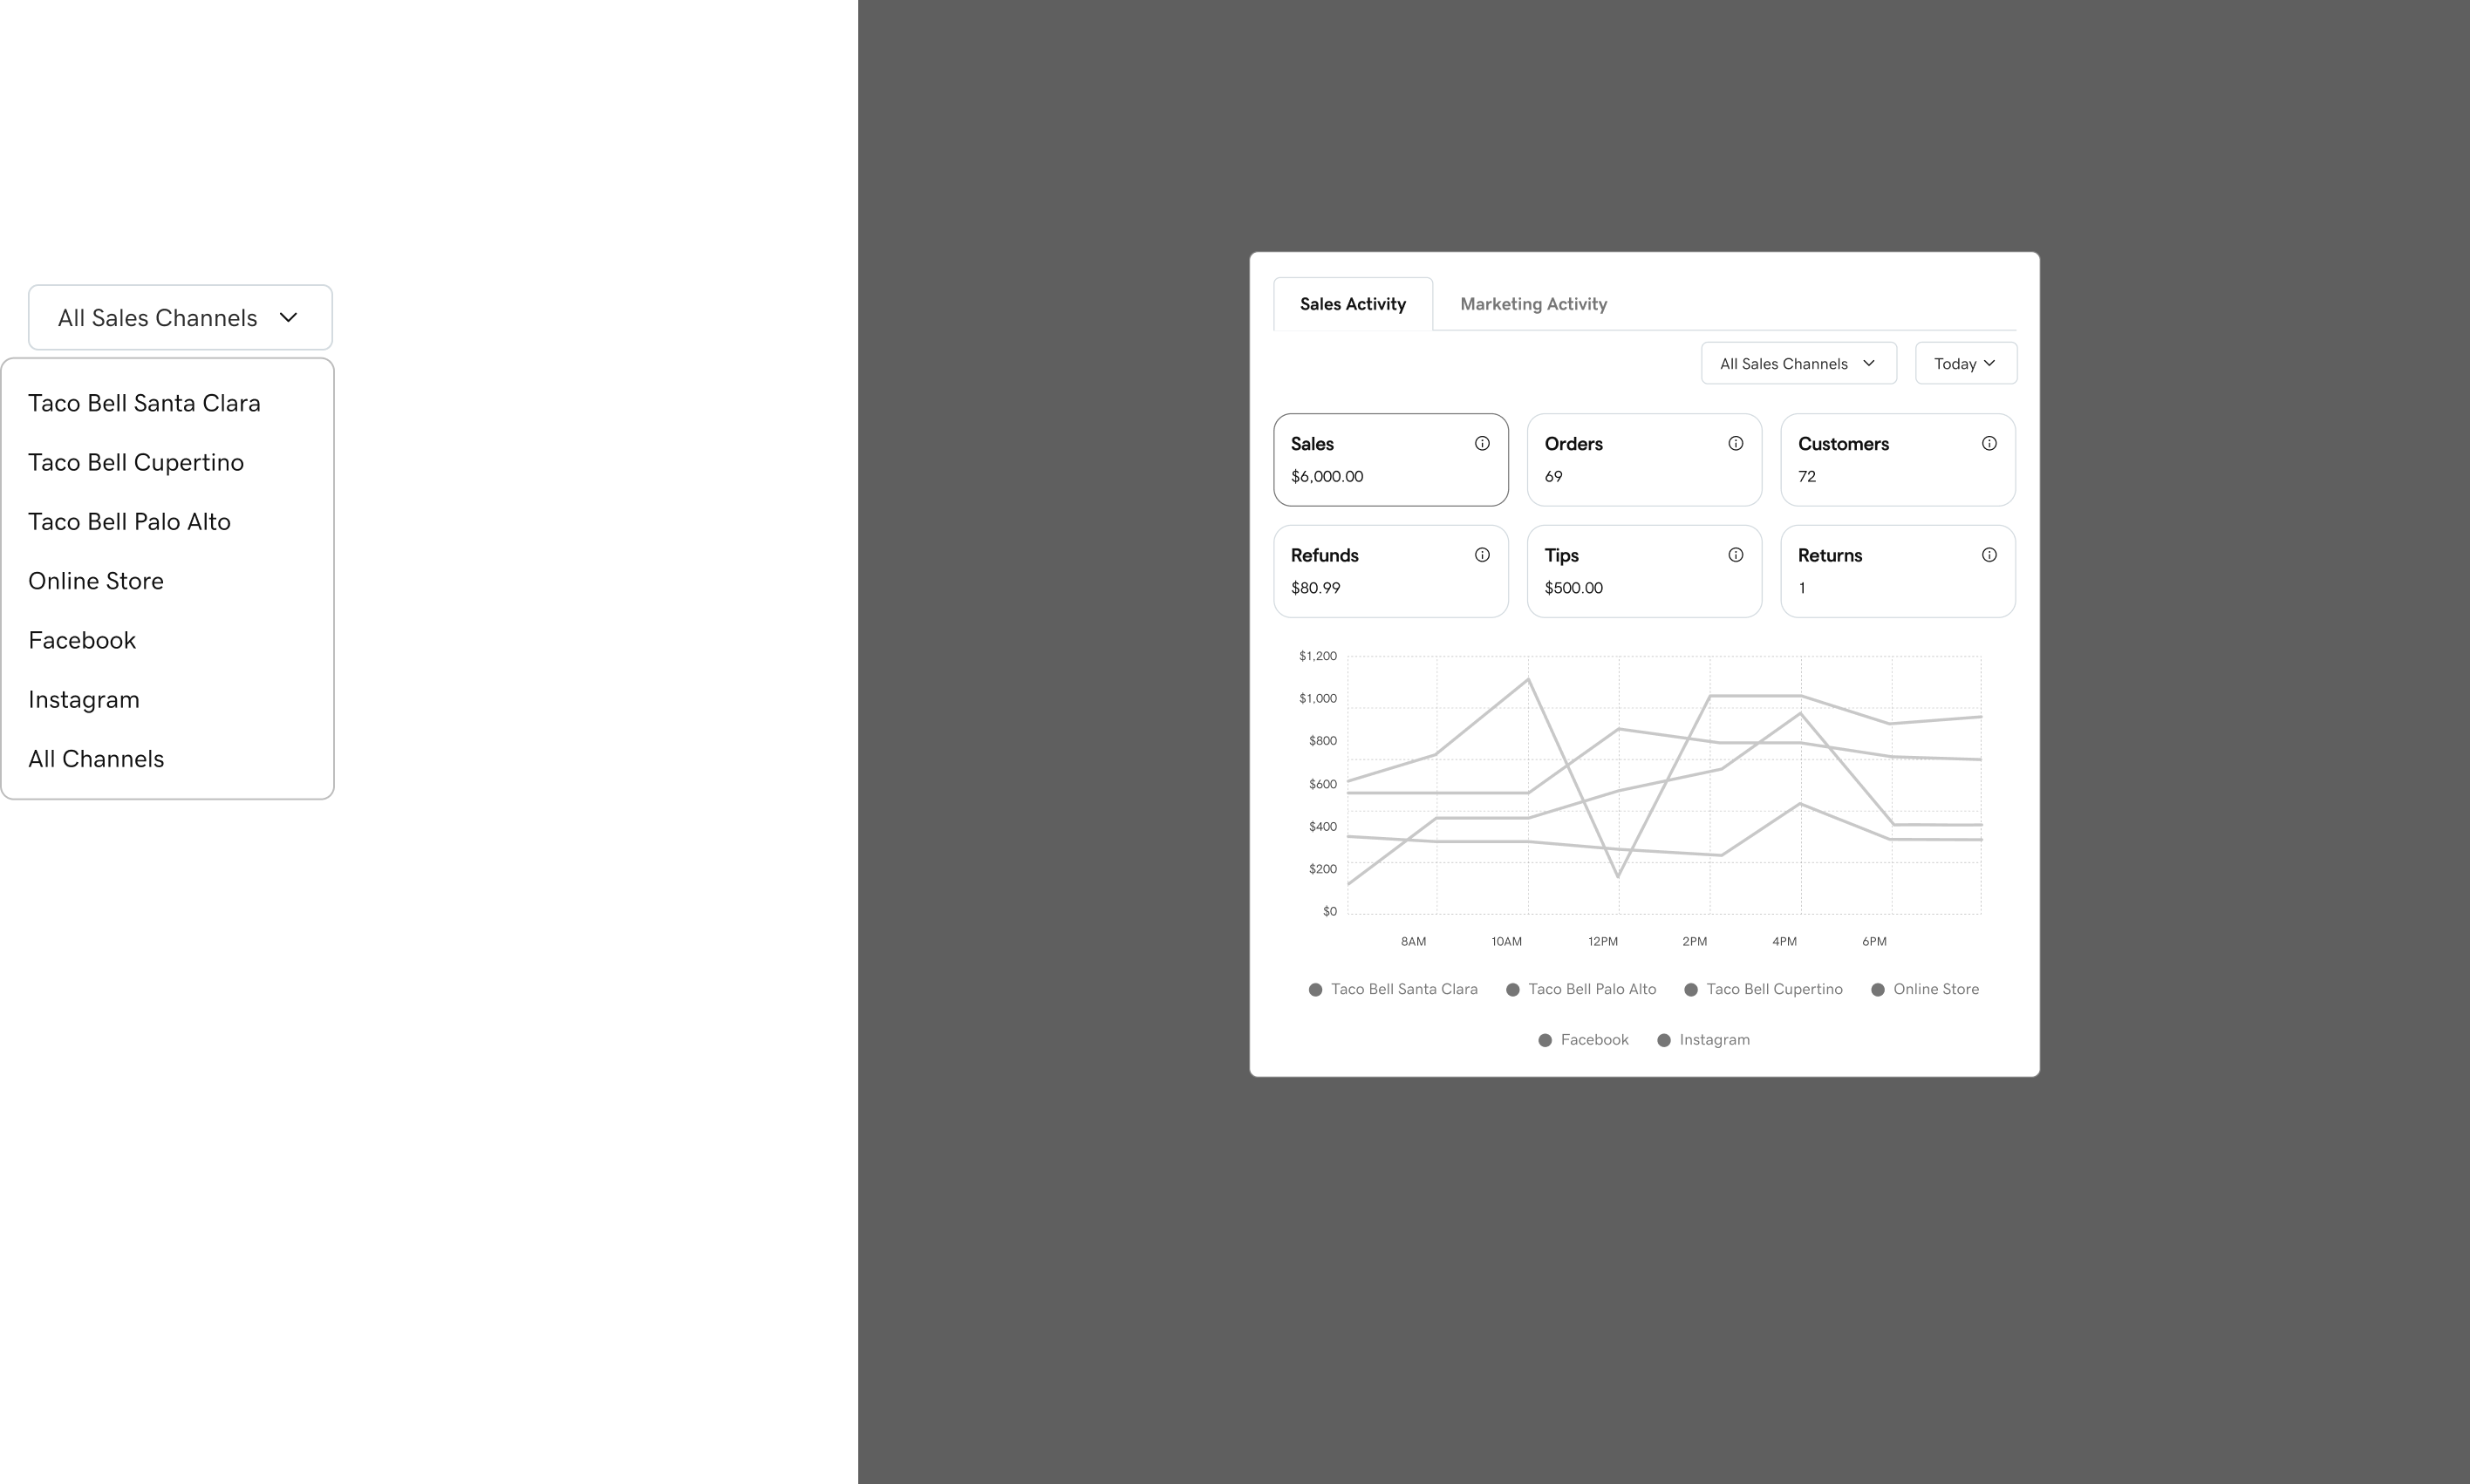
Current filter is unsuitable. Single-select dropdown doesn't support multi-location comparison or complex filtering scenarios.
We built and tested a prototype to surface exactly where the filter broke down — then used those findings to evaluate three proposals before landing on a final design.
Step 1 — What we tested
Features
Test Tasks
Step 2 — What testing revealed
The single-select dropdown forces users to switch repeatedly — making multi-location or multi-channel comparisons nearly impossible.
Users intuitively tried clicking the chart to filter — suggesting the filter interaction should feel closer to the data, not separate from it.
Power users preferred a “set up → apply → review” workflow rather than live dropdown changes that instantly altered charts.
Taking the best of each proposal → combining into one unified panel

Step 4 — Final Decision
All filters visible in one panel → easier overview. Works more like a configuration, convenient for users who don’t need to switch often.
Easily accommodates future filters (date range, store type) and supports responsive design and accessibility.
Supports a “set → apply → review” workflow, aligning better with how users perform multi-condition data analysis than instant dropdown changes.
The final design resolved fragmentation, established clear permission tiers, and introduced a filter model validated through multiple rounds of testing.
Did we hit our goals?
Three distinct access tiers — Brands Overall Owner, Sub Brand Owner, and Store Manager — are fully defined with explicit allowed and restricted actions, and surfaced clearly in the UI model.
AchievedThe panel-based filter replaced single-select dropdowns. Supports multi-location and multi-channel selection simultaneously, with architecture extensible to date ranges, store types, and future omni-channel scenarios.
AchievedThree clear access tiers — Brands Overall Owner, Sub Brand Owner, Store Manager each with defined allowed and restricted actions.
A configuration-style filter panel replacing single-select dropdowns. Supports multi-location comparison and future extensibility (date range, store type).
Resolved ambiguity around “sale” and “sales channel” terminology with consistent definitions aligned to how SMB owners actually think about their business.
